Short-term rental market research
Find profitable Airbnb markets before you invest
See ranked cities by Airbnb profitability, browse each market's active listings, and see revenue-maximizing amenities.
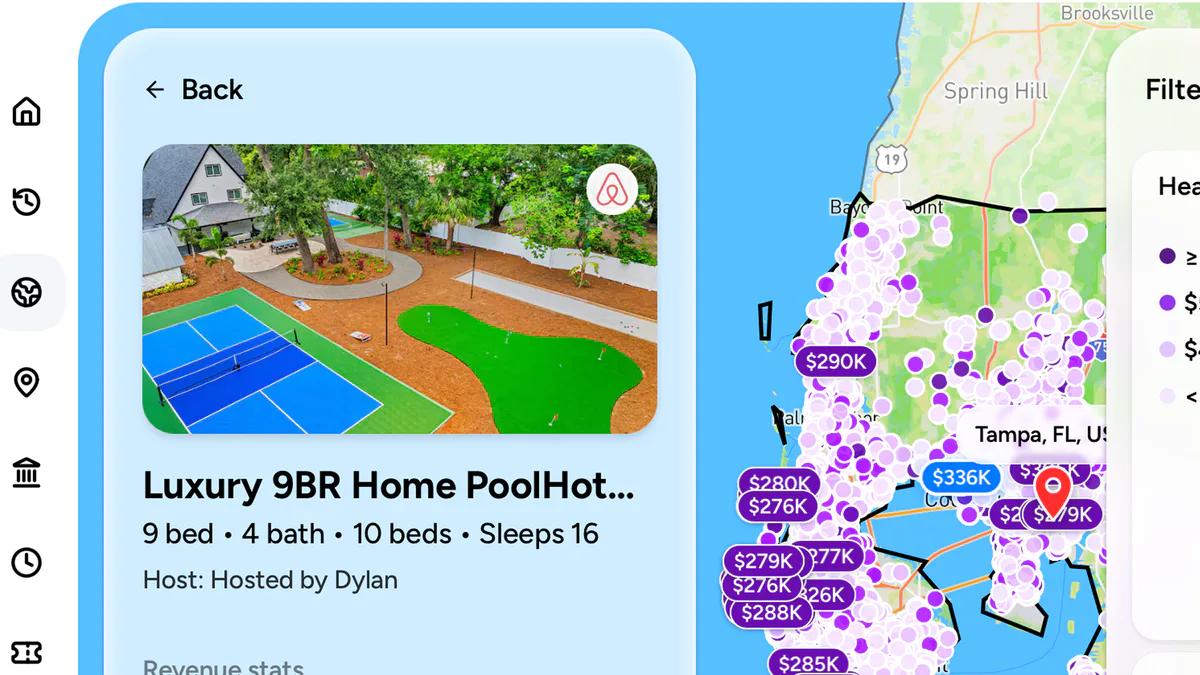
Data Trusted By


One view. Better decisions.
Build your market shortlist—and your listing strategy
Choose where to invest, benchmark nearby competitors, and find ways to increase revenue after you launch.
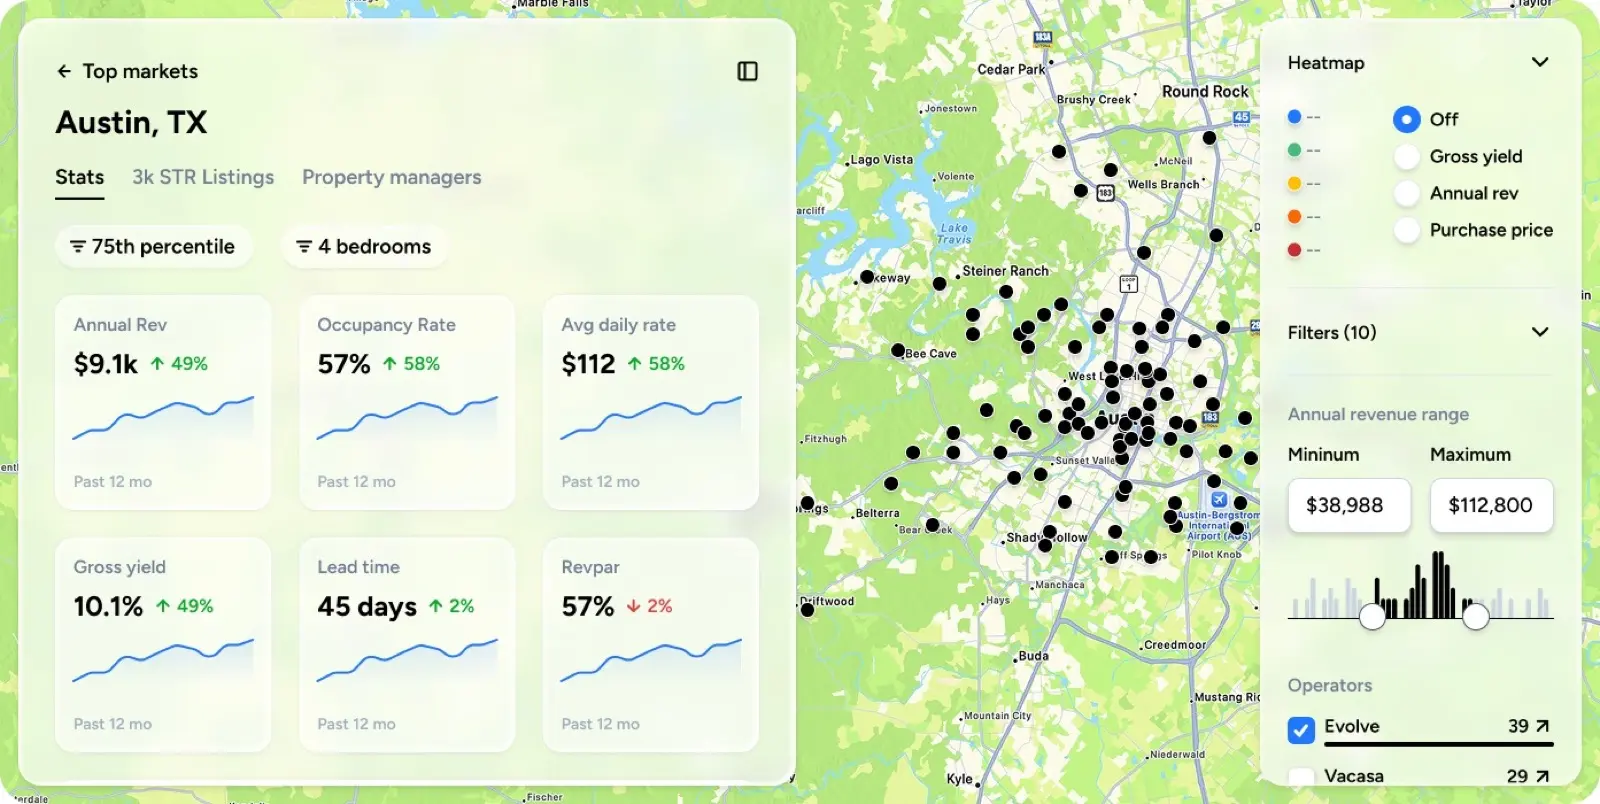
Choose the right city
Rank markets by Airbnb profitability
Compare annual revenue, occupancy, daily rate, gross yield, and seasonality across 2,300+ short-term rental markets in 157 countries.
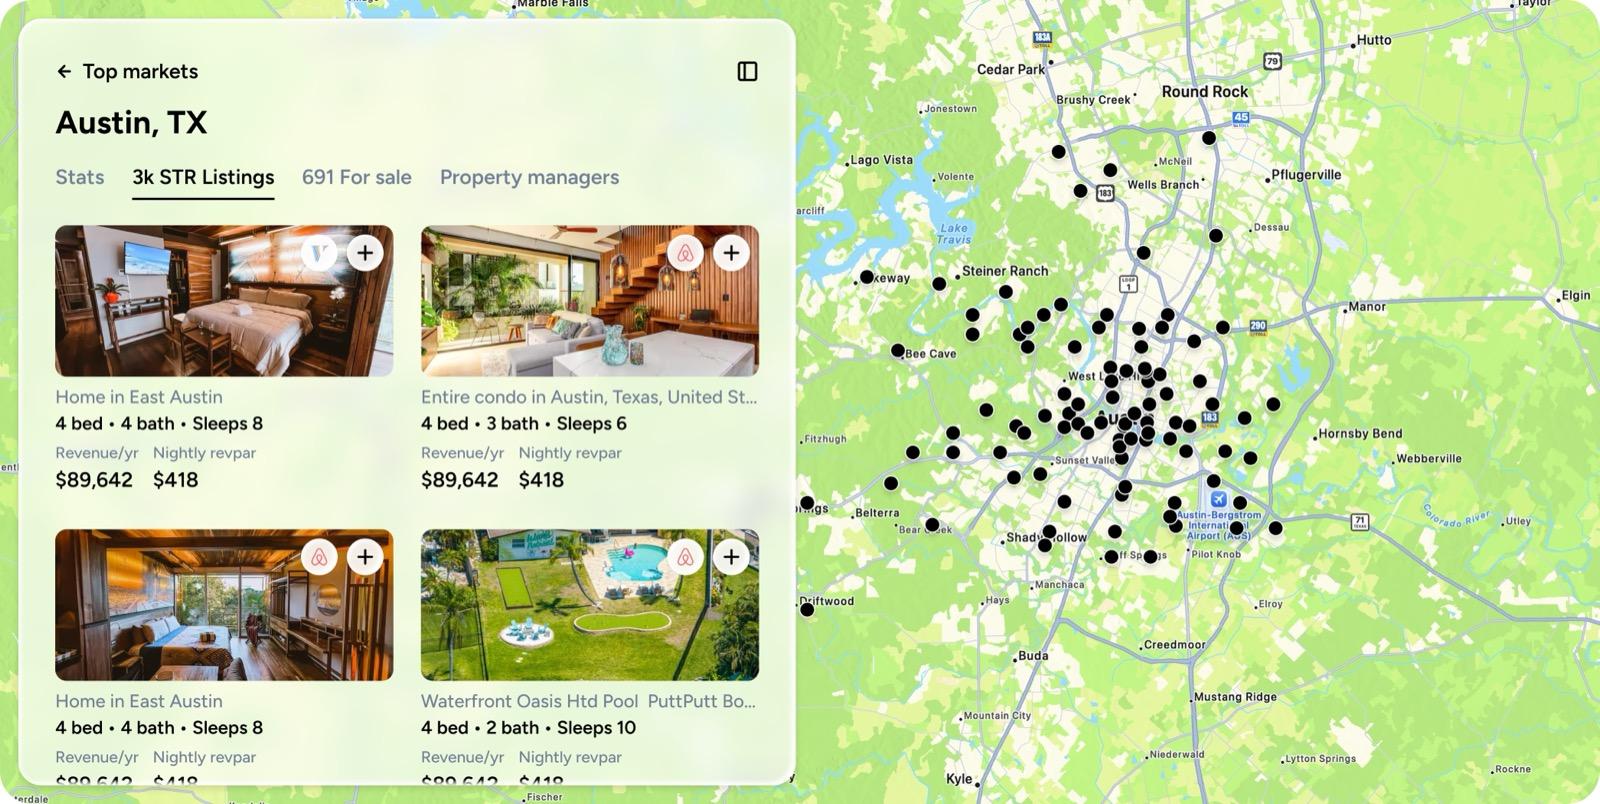
Know the competition
Browse Airbnb and Vrbo listings
Open real listings on the map, compare bedroom counts and revenue, and build a comp set around the properties that matter.
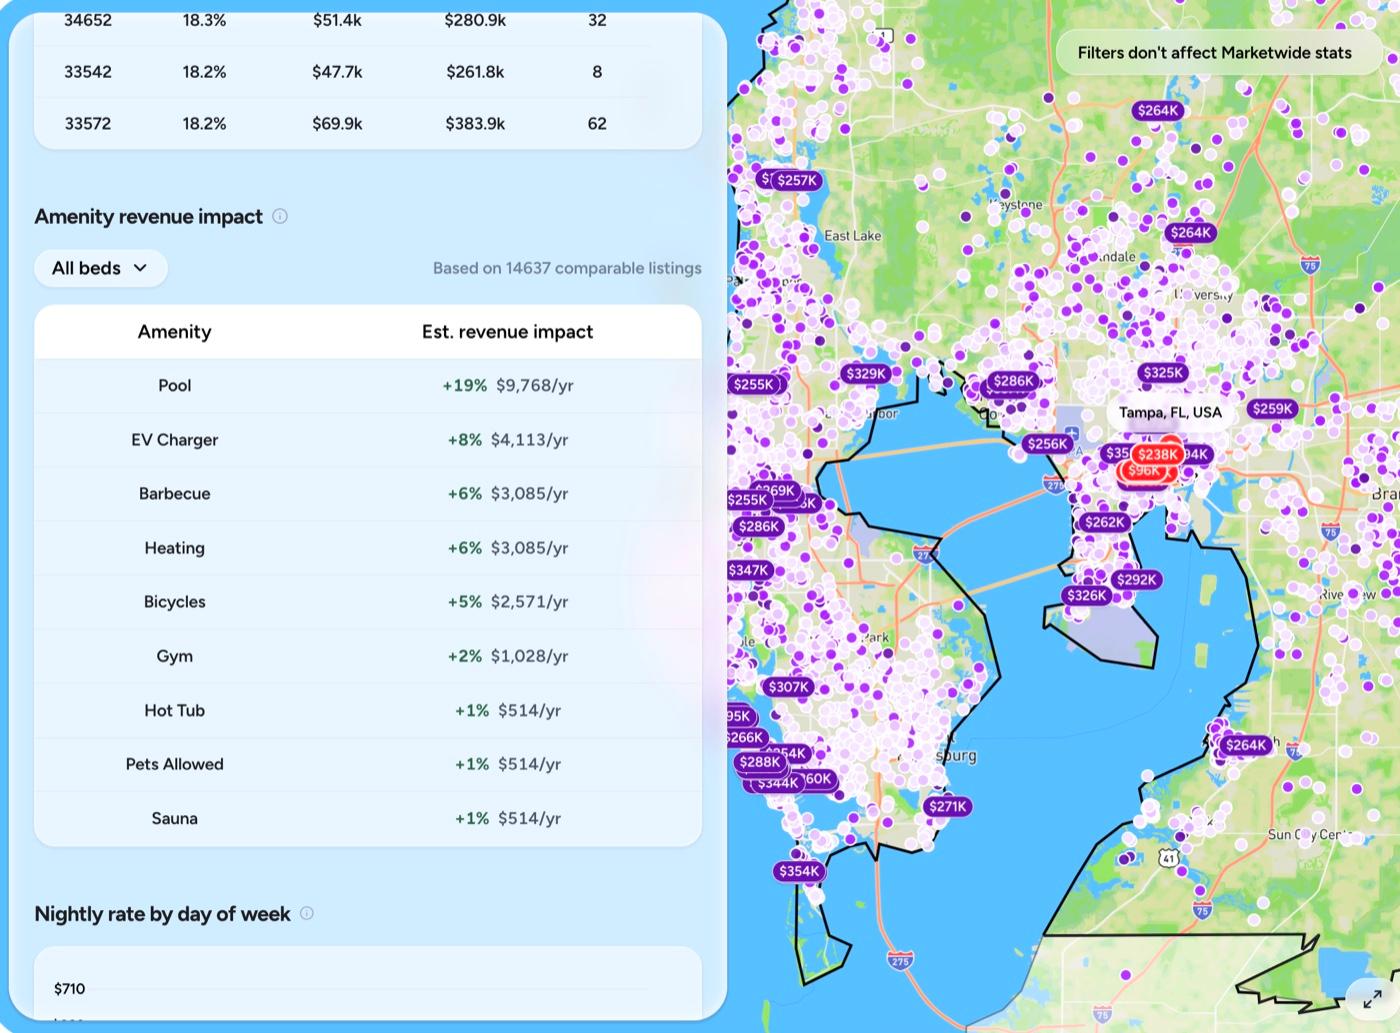
Improve the listing
See which amenities can drive more revenue
Measure the revenue impact of pools, hot tubs, EV chargers, and other amenities using comparable listings in the market.
What it is
BNBCalc Markets, explained
BNBCalc Markets is BNBCalc's market research product, and it works worldwide. It covers 2,300+ short-term rental markets in 157 countries, roughly four in five of them outside the US, built from 10M+ Airbnb and Vrbo listings, and it launched as its own product in June 2026. Rank cities by annual revenue, open any market to see its active listings on the map, save the ones that match your buy box as a comp set, and check which operators and amenities are winning there.
It costs $79 per month or $399 per year and includes the full BNBCalc Calculator, so the same account and search bar you use to find a market also runs the numbers on a specific address. US markets add two things: gross yield, which needs property values that are widely available only in the US, and for-sale housing conditions, using data from Redfin, a national real estate brokerage.
- 2,300+ markets
- 157 countries, worldwide
- 10M+ Airbnb and Vrbo listings
- 487 US markets across all 50 states
- $79/mo or $399/yr, Calculator included
What's inside Markets
- Rank markets worldwide by annual revenue, with occupancy, nightly rate and seasonality for every market; US markets also rank by gross yield
- Heatmaps for revenue, annual revenue, gross yield, estimated value, performance and nightly rate
- A market's active Airbnb and Vrbo listings, with filters
- Comp sets you can save, share and export to CSV
- Operator profiles, so you can benchmark against specific competitors
- Amenity revenue impact, split by bedroom count
- US housing market insights: sale prices, homes available and days on market (data from Redfin, a national real estate brokerage)
- Figures in nine major currencies or the market's own, plus the full Calculator
US Airbnb statistics
What a typical US Airbnb earns
Medians across the 454 US markets with a full year of BNBCalc data, October 2025 to September 2026. Open any market to see its own numbers.
$41,059
Median annual revenue
Source: BNBCalc Markets, October 2025 to September 2026
38.4%
Median occupancy
Source: BNBCalc Markets, October 2025 to September 2026
$257
Median nightly rate
Source: BNBCalc Markets, October 2025 to September 2026
Who uses BNBCalc Markets
Real estate investors
Rank markets by annual revenue, and by gross yield in the US, before you choose where to buy.
Hosts and property managers
Benchmark a listing against nearby comps and see which amenities lift revenue in your market.
Real estate agents
Show clients what short-term rentals earn in a market, with the listings behind the number.
Airbnb market data for 2,300+ markets
Top Short Term Rental Markets
Top Cash-Flowing Markets in USA
All beds, Average performance, By Gross Yield
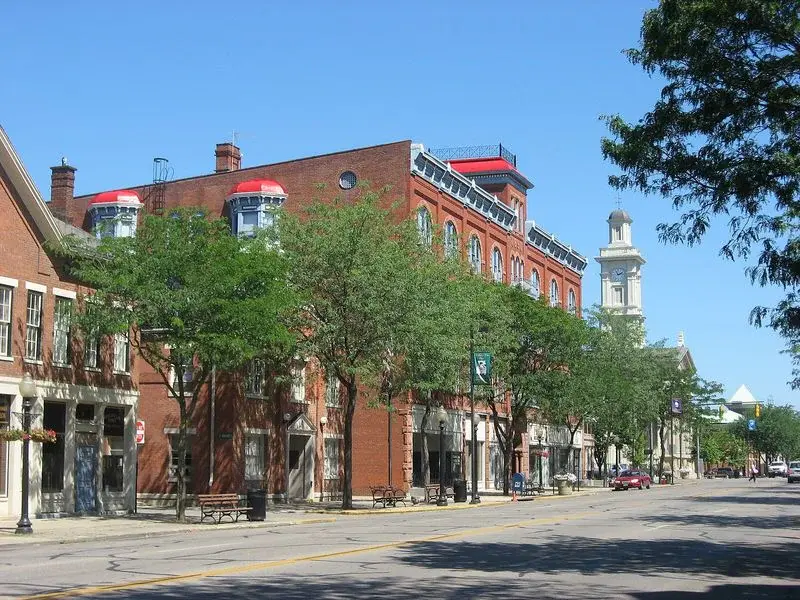
Chillicothe, OH
Revenue
$75K/yr
Gross Yield
24.3%

Parsons, KS
Revenue
$22K/yr
Gross Yield
23.3%
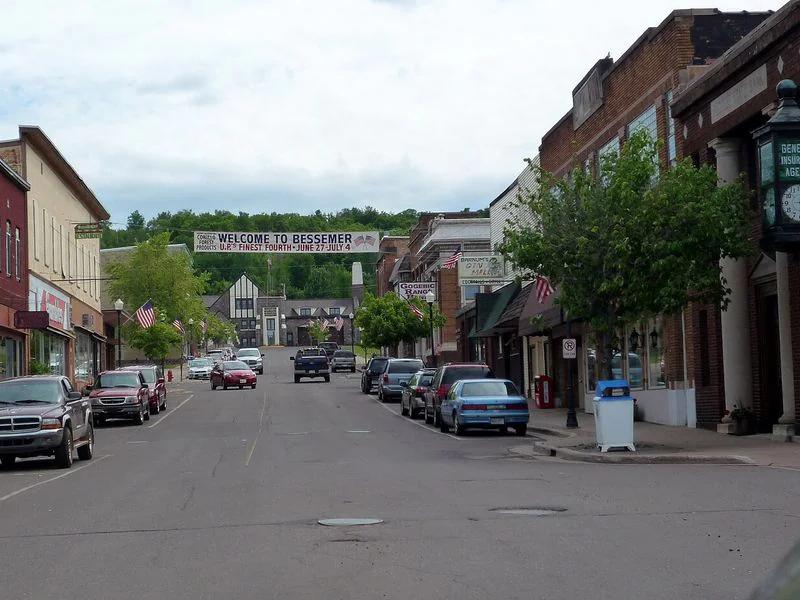
Bessemer, MI
Revenue
$37K/yr
Gross Yield
21.5%

Lawton, OK
Revenue
$28K/yr
Gross Yield
21.2%

Niagara Falls, NY
Revenue
$39K/yr
Gross Yield
21.2%

Homer, AK
Revenue
$45K/yr
Gross Yield
21.1%

Bartlesville, OK
Revenue
$31K/yr
Gross Yield
20.8%
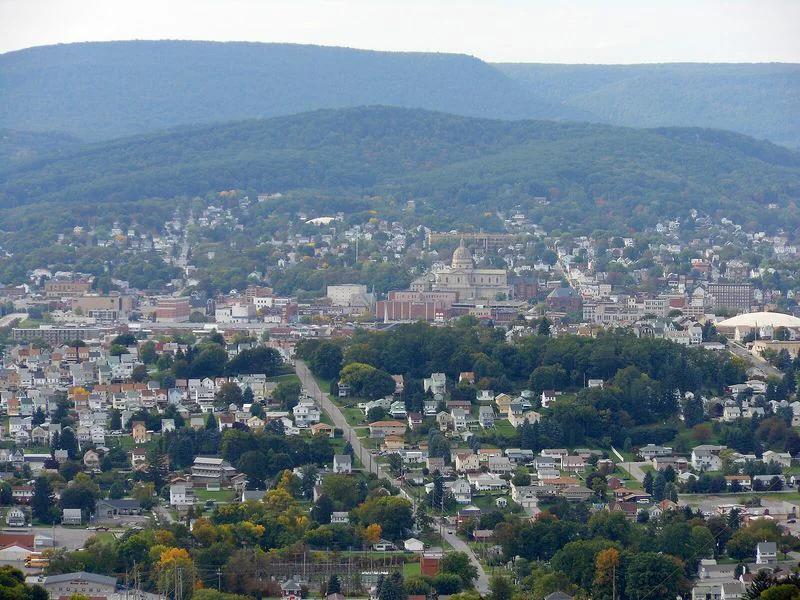
Altoona, PA
Revenue
$35K/yr
Gross Yield
20.7%
See all →
Best Markets for Luxury Vacation Homes in USA
All beds, High performance, By Revenue

Maui, HI
Revenue
$283K/yr
Gross Yield
24.7%

Aspen, CO
Revenue
$246K/yr
Gross Yield
10.4%

Miami Beach, FL
Revenue
$239K/yr
Gross Yield
35.6%

Florida Keys, FL
Revenue
$228K/yr
Gross Yield
18.9%

Monterey Bay, CA
Revenue
$226K/yr
Gross Yield
12.3%

Santa Rosa Beach, FL
Revenue
$223K/yr
Gross Yield
20.2%

The Hamptons, NY
Revenue
$214K/yr
Gross Yield
12.5%
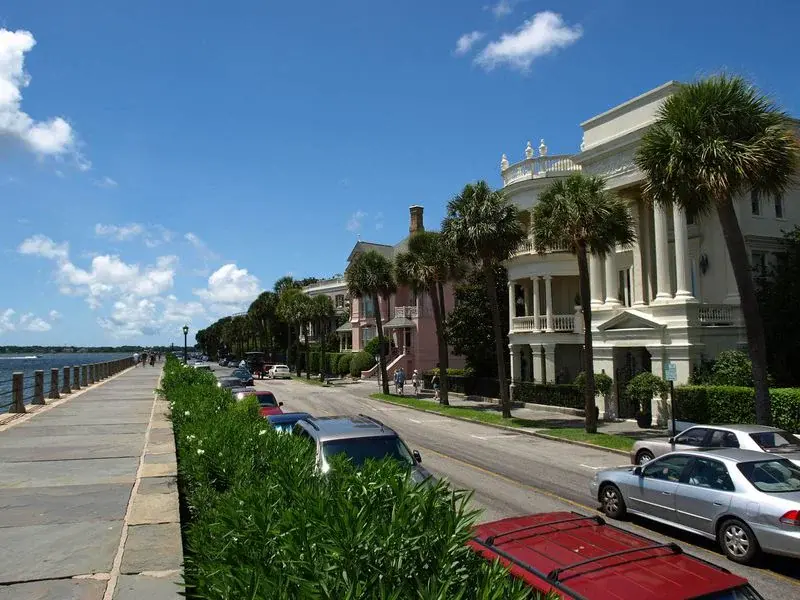
Charleston, SC
Revenue
$212K/yr
Gross Yield
15.1%
See all →
Top Large-Home Markets in Florida
4+ BR, Average performance, By Gross Yield

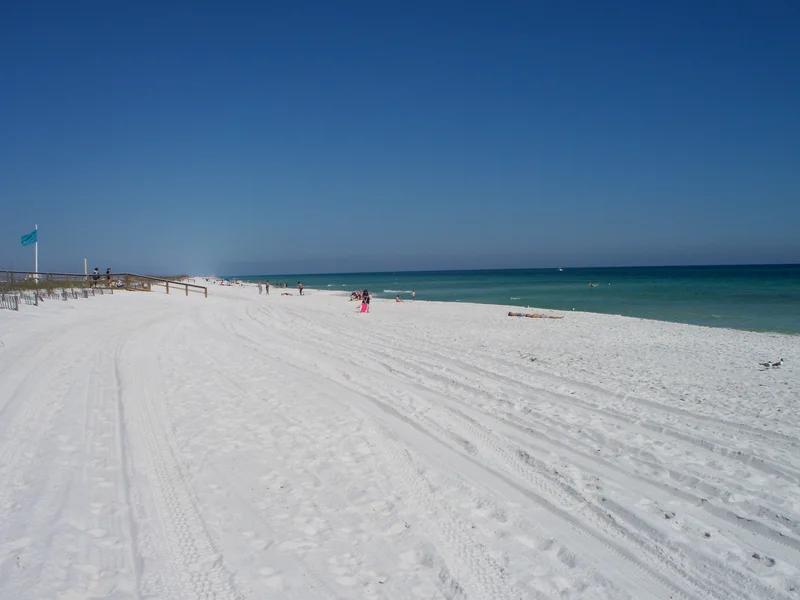
Fort Walton, FL
Revenue
$86K/yr
Gross Yield
12.2%
Navarre, FL
Revenue
$109K/yr
Gross Yield
10.1%

Walt Disney World (North), FL
Revenue
$92K/yr
Gross Yield
10.0%

Pensacola, FL
Revenue
$78K/yr
Gross Yield
10.0%

Amelia Island, FL
Revenue
$108K/yr
Gross Yield
9.7%
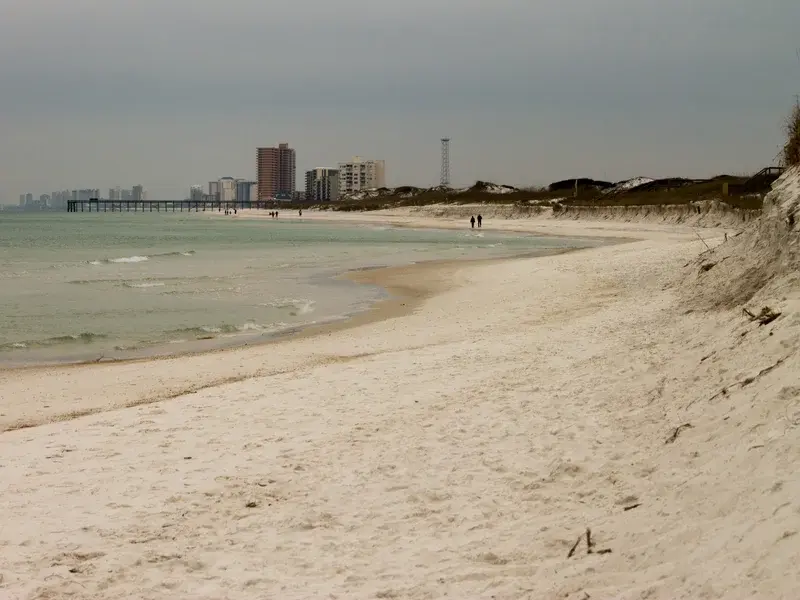
Panama City Beach, FL
Revenue
$116K/yr
Gross Yield
9.5%

Tallahassee, FL
Revenue
$43K/yr
Gross Yield
9.4%

Jacksonville, FL
Revenue
$64K/yr
Gross Yield
9.3%
See all →
Top Luxury Markets in Mexico
All beds, High performance, By Revenue


Top 2 Bedroom Markets in Italy
2 BR, Average performance, By Revenue


Best Airbnb Markets by State
US markets ranked by gross yield
Trusted by thousands of investors
What our users say
“Most under-rated tool. The tax savings feature alone makes my subscription worth it.”
John Bianchi
Head of Data, STR Search / Techvestor
“Love using BNBCalc especially when it comes to drawing up quick projections on the fly of a potential clients property to see if they're hitting the projected numbers. BNBCalc helps me close new clients.”
Jackson Sterns
Property Manager, Tampa Bay Stays LLC
“This tool is amazing! Used it to find my first short term rental. It was very helpful in better understanding the market. Definitely a must-have tool if you are considering purchasing an STR.”
Jake Kempton
“I have to admit that this is one of the most useful tools I’ve used in helping me decide on the short term rental property. It breaks down the projections for the occupancy rate and by percentage on multiple studies!! Also, the seasonality by month. And the potential tax savings I’ll get.”
Elaine Young
“I use this tool to evaluate all of my short-term rental opportunities. It provides a consistent and intuitive template, useful comparisons, and a flexible interface.”
Peter Aylaian
“I really liked that I could do a quick analysis on the website instead of setting up my spreadsheet. Great tool that saves a lot of time when evaluating properties.”
Afrina M
“The BNBCalc was excellent, and I liked how I could compare it to nearby rentals. I am looking to build on a vacant lot (that I already own) soon, so the BNBCalc helped ensure my decision to build a STR was a good one.”
Lynd Utke
“Very easy to use and necessary to understand a local market or an area where to invest with new apartments.”
Aldo Santoro
BNBCalc Markets FAQ
What is BNBCalc Markets?
BNBCalc Markets is BNBCalc's worldwide market research product, launched in June 2026. It covers 2,300+ short-term rental markets in 157 countries, roughly four in five of them outside the US, and lets you rank markets by annual revenue, see a market's active Airbnb and Vrbo listings on a map, build comp sets, track operators and measure which amenities lift revenue. US markets also rank by gross yield. It costs $79 per month or $399 per year and includes the Calculator.
How much does BNBCalc Markets cost?
Markets costs $79 per month or $399 per year, with a 7-day free trial. It includes unlimited property analyses in the BNBCalc Calculator, which costs $30 per month or $199 per year on its own.
Which markets and countries does BNBCalc Markets cover?
As of September 2026, Markets covers 2,300+ short-term rental markets in 157 countries, including 487 US markets across all 50 states, and roughly four in five markets are outside the US. Listings come from both Airbnb and Vrbo. Every market ranks by annual revenue, while gross yield and property values are US-only because that data is widely available only in the US.
How is Markets different from the BNBCalc Calculator?
The Calculator answers one question: what will this address earn, and does the deal work once you add expenses, financing and taxes? Markets answers the question before that one: which city, which neighborhood and which type of property. Markets includes the Calculator, so once a market looks right you can analyze a specific address from the same account. If you're new to Markets, BNBCalc's Help Center walks through how to research a market with BNBCalc Markets, from the rankings to each market page's tabs.
Where does the Markets data come from?
Revenue, occupancy and nightly-rate figures come from the historical performance of 10M+ Airbnb and Vrbo listings. US housing market figures are data from Redfin, a national real estate brokerage. All figures are estimates, so verify them locally before you buy. BNBCalc's Help Center explains how BNBCalc Markets calculates occupancy, ADR and annual revenue.
How does BNBCalc Markets compare to AirDNA?
Both help you research short-term rental markets. The difference is what comes in the same subscription: BNBCalc Markets includes the full Calculator, so once you've picked a market you can underwrite a specific address with a mortgage, cash flow, cash-on-cash return and estimated tax savings. Markets is also month to month at $79 per month, with a 7-day free trial.
Find your next profitable market
Compare markets, listings, and revenue opportunities free for 7 days.